For this project, I wanted to find a way to predict the salaries for data science jobs in the Boston area.
I analyzed search results from Indeed.com, an online jobs board, and highlighted key phrases in each job posting. I also determined if each job’s salary is above a threshold value. I used logistic regression to model this data. Machine learning and python experience were the strongest predictors of salary. Machine learning, python and scientist were the strongest predictors of salary. The model had low precision — approximately 63% precision and recall, where random guesses could have achieved 57% — which may have been caused by variability in the source salary data.
Part I outlines the code used. Part II contains the writeup.
Part I: Code
Import libraries
# web scraping
from urllib.request import urlopen
from bs4 import BeautifulSoup

#Data and analysis
import numpy as np
import pandas as pd
import statsmodels.formula.api as sm
from sklearn import preprocessing, linear_model, metrics

# Plotting
import matplotlib.pyplot as plt
import seaborn as sns

%matplotlib inline
params = {'legend.fontsize': 'x-large',
          'figure.figsize': (10, 6),
         'axes.labelsize': 'x-large',
         'axes.titlesize': 20,
         'xtick.labelsize':'x-large',
         'ytick.labelsize':'x-large'}
plt.rcParams.update(params)
Define web scraping functions
def count_results(query = None, location = "Boston", binary_level = 1):
    job_ids = pd.DataFrame()

    result_list = []

    # Find the number of results
    URL_for_count = "http://www.indeed.com/jobs?q=data+scientist+{}&jt=fulltime&l={}".format(query, location)
    soup_for_count = BeautifulSoup(urlopen(URL_for_count).read(), 'html.parser')

    results_number = soup_for_count.find("div", attrs = {"id": "searchCount"}).text
    number_of_results = int(results_number.split(sep = ' ')[-1].replace(',', ''))

    # Now loop through the pages. Viewing 100 results at a time means fewer page refreshes, which are a bottleneck.
    i = int(number_of_results/100)
    for page_number in range(i + 1):
        URL_for_results = "http://www.indeed.com/jobs?q=data+scientist+{}&jt=fulltime&l={}&limit=100&start={}".format(query, location, str(100 * page_number))
        soup_for_results = BeautifulSoup(urlopen(URL_for_results).read(), 'html.parser')
        results = soup_for_results.find_all('div', attrs={'data-tn-component': 'organicJob'})

        # Extract the ID for each job listing
        for x in results:
            job_id = x.find('h2', attrs={"class": "jobtitle"})['id']
            job_title = x.find('a', attrs={'data-tn-element': "jobTitle"}).text.strip().capitalize()
            job_link = "https://www.indeed.com" + x.find('h2', attrs={"class": "jobtitle"}).find('a')['href']
            result_list.append([job_id, job_title, job_link, binary_level])

        # Add the job ID numbers
        job_ids = job_ids.append(result_list)

    # Remove re-posted jobs
    job_ids.drop_duplicates(inplace = True)
    return job_ids
# String format: "keyword, keyword combination, keyword, ..."
def count_results_by_keywords(query_string = None):

    # Ends the function if given invalid inputs
    if query_string == None:
        return(print("No keyword entered."))

    # Format the keyword string in to URL query
    query = "%20OR%20".join(query_string.split(", "))
    query = query.replace(' ', '+')

    # Perform the search
    job_ids = count_results("%28{}%29".format(query))

    # Rename job_ids's columns
    job_ids.columns = ['id', 'job title', 'job link', '{}'.format(" OR ".join(query_string.split(", ")))]

    return (job_ids)


def count_results_by_salary(salary_range_divider = None, salary_floor = 20000):

    if salary_range_divider <= salary_floor:
        return(print("Enter a number larger than ${}.".format(salary_floor)))

    job_ids = pd.DataFrame()
    # Set dividing salaries
    divider_strings = ["+${}-{}".format(salary_floor, salary_range_divider), "+${}".format(salary_range_divider)]

    # Perform two searches, starting with the low-salary jobs
    for level, salary_criterion in enumerate(divider_strings):
        job_ids = job_ids.append(count_results(salary_criterion, binary_level=level))

    # Rename job_ids's columns
    job_ids.columns = ['id', 'job title', 'job link', 'salary over {}'.format(salary_range_divider)]

    return(job_ids)


def count_results_by_years_experience(years_experience = None):

    # Ends the function if given invalid inputs
    if years_experience == None or type(years_experience) != int:
        return(print("Enter an integer value."))

    # Format the keyword string in to URL query
    query = "{}+years+or+{}%2B+years".format(str(years_experience), str(years_experience))

    # Perform the search
    job_ids = count_results("%28{}%29".format(query), binary_level = years_experience)

    # Rename job_ids's columns
    job_ids.columns = ['id', 'job title', 'job link', 'years experience']

    return (job_ids)
Collect data
Each dataframe is produced in a separate cell so that keywords can be adjusted or new searches added more quickly.
phd_dataframe = count_results_by_keywords("PhD, ph.d")
bachelors_dataframe = count_results_by_keywords("Bachelors, BS, BA") # Indeed.com's search includes "Bachelor's", "B.S.", etc.
python_dataframe = count_results_by_keywords("Python")
# Use %22 ... %22 to ensure at least one of these keywords are present
management_dataframe = count_results_by_keywords("%22Manager%22, %22director%22")

# Rename the column to a readable format
management_dataframe.columns = ['id', 'job title', 'job link', 'Manager OR director']
startup_dataframe = count_results_by_keywords("Startup, start-up")
scientist_dataframe = count_results_by_keywords("Scientist")
machine_learning_dataframe = count_results_by_keywords("Machine learning")
lab_dataframe = count_results_by_keywords("Lab, laboratory")
# Use %22 ... %22 to search for the exact phrase "Software engineer"
software_engineer_dataframe = count_results_by_keywords("%22Software engineer%22")

# Rename the column to a readable format
software_engineer_dataframe.columns = ['id', 'job title', 'job link', 'Software engineer']
experience_results_dataframe = pd.DataFrame()

# Scan search results from a range of year requirements
for years in range(1+7):
    experience_results_dataframe = experience_results_dataframe.append(count_results_by_years_experience(years))

experience_results_dataframe['years experience'].astype(int).astype('category', ordered = True, copy = False)
years_dummies_dataframe = pd.get_dummies(experience_results_dataframe['years experience'], prefix = 'years experience', prefix_sep = ' ')
experience_dataframe = pd.concat(objs = [experience_results_dataframe.drop('years experience', axis = 1), years_dummies_dataframe], axis = 1)
salary_dataframe = count_results_by_salary(90000)
Combine data
common_columns = ['id', 'job title', 'job link']
master_dataframe = phd_dataframe.merge(bachelors_dataframe, on = common_columns, how = 'outer')\
    .merge(python_dataframe, on = common_columns, how = 'outer')\
    .merge(startup_dataframe, on = common_columns, how = 'outer')\
    .merge(scientist_dataframe, on = common_columns, how = 'outer')\
    .merge(machine_learning_dataframe, on = common_columns, how = 'outer')\
    .merge(lab_dataframe, on = common_columns, how = 'outer')\
    .merge(software_engineer_dataframe, on = common_columns, how = 'outer')\
    .merge(management_dataframe, on = common_columns, how = 'outer')\
    .merge(experience_dataframe, on = common_columns, how = 'outer')\
    .merge(salary_dataframe, on = common_columns, how = 'outer')

# Convert non-id columns to integers and fill NaN values
data_conversion_mask = (master_dataframe.columns != 'id') & (master_dataframe.columns != 'job title') & (master_dataframe.columns != 'job link')
master_dataframe.ix[:, data_conversion_mask] = master_dataframe.ix[:, data_conversion_mask].fillna(value = 0).astype(int)
master_dataframe.head(3)
| id | job title | job link | PhD OR ph.d | Bachelors OR BS OR BA | Python | Startup OR start-up | Scientist | Machine learning | Lab OR laboratory | ... | Manager OR director | years experience 0 | years experience 1 | years experience 2 | years experience 3 | years experience 4 | years experience 5 | years experience 6 | years experience 7 | salary over 90000 | |
|---|---|---|---|---|---|---|---|---|---|---|---|---|---|---|---|---|---|---|---|---|---|
| 0 | jl_7896e61d3e45dfb4 | Scientist, research and modeling - cyber risk | https://www.indeed.com/rc/clk?jk=7896e61d3e45d... | 1 | 0 | 0 | 0 | 0 | 0 | 0 | ... | 0 | 0 | 0 | 0 | 0 | 0 | 0 | 0 | 0 | 0 |
| 1 | jl_a116f7a8d8db626e | Research scientist, muscle | https://www.indeed.com/rc/clk?jk=a116f7a8d8db6... | 1 | 0 | 0 | 0 | 1 | 0 | 0 | ... | 0 | 0 | 0 | 0 | 1 | 0 | 0 | 0 | 0 | 0 |
| 2 | jl_89b3b83a5b0fd82c | Cellular analytics scientist | https://www.indeed.com/rc/clk?jk=89b3b83a5b0fd... | 1 | 1 | 0 | 0 | 1 | 0 | 1 | ... | 0 | 0 | 0 | 1 | 0 | 0 | 0 | 0 | 0 | 1 |
3 rows × 21 columns
# Create a dataframe that keeps only the data features for analysis
data_dataframe_mask = (master_dataframe['Lab OR laboratory'] == 0) | (master_dataframe['Software engineer'] == 1)
data_dataframe = master_dataframe[data_dataframe_mask].drop(labels = common_columns, axis = 1).drop(labels = ['Lab OR laboratory', 'Software engineer'], axis = 1)
#data_dataframe.loc[:, 'years experience'] = sklearn.preprocessing.minmax_scale(data_dataframe['years experience'].astype(float), copy = False)
Model with statsmodel logistic regression
sm_model_dataframe = data_dataframe.copy()
sm_model_dataframe.columns = sm_model_dataframe.columns.str.replace(' ', '_').str.replace('.', '_').str.replace('-', '_')
sm_model_dataframe.columns
Index(['PhD_OR_ph_d', 'Bachelors_OR_BS_OR_BA', 'Python', 'Startup_OR_start_up',
       'Scientist', 'Machine_learning', 'Manager_OR_director',
       'years_experience_0', 'years_experience_1', 'years_experience_2',
       'years_experience_3', 'years_experience_4', 'years_experience_5',
       'years_experience_6', 'years_experience_7', 'salary_over_90000'],
      dtype='object')
sm_model = sm.logit("salary_over_90000 ~ PhD_OR_ph_d + Bachelors_OR_BS_OR_BA + Python + Startup_OR_start_up + Scientist + Machine_learning + Manager_OR_director + years_experience_0 + years_experience_1 + years_experience_2 + years_experience_3 + years_experience_4 + years_experience_5 + years_experience_6 + years_experience_7", data=sm_model_dataframe).fit()
sm_model.summary()
Optimization terminated successfully.
         Current function value: 0.625174
         Iterations 5
| Dep. Variable: | salary_over_90000 | No. Observations: | 1128 |
|---|---|---|---|
| Model: | Logit | Df Residuals: | 1112 |
| Method: | MLE | Df Model: | 15 |
| Date: | Tue, 03 Jan 2017 | Pseudo R-squ.: | 0.08790 |
| Time: | 10:06:47 | Log-Likelihood: | -705.20 |
| converged: | True | LL-Null: | -773.16 |
| LLR p-value: | 1.460e-21 |
| coef | std err | z | P>|z| | [95.0% Conf. Int.] | |
|---|---|---|---|---|---|
| Intercept | -0.6329 | 0.132 | -4.795 | 0.000 | -0.892 -0.374 |
| PhD_OR_ph_d | -0.0532 | 0.148 | -0.360 | 0.718 | -0.343 0.236 |
| Bachelors_OR_BS_OR_BA | 0.0686 | 0.173 | 0.397 | 0.691 | -0.270 0.407 |
| Python | 1.1100 | 0.181 | 6.117 | 0.000 | 0.754 1.466 |
| Startup_OR_start_up | 0.2948 | 0.216 | 1.366 | 0.172 | -0.128 0.718 |
| Scientist | 0.5263 | 0.168 | 3.125 | 0.002 | 0.196 0.856 |
| Machine_learning | 0.4836 | 0.194 | 2.489 | 0.013 | 0.103 0.864 |
| Manager_OR_director | 0.4290 | 0.169 | 2.537 | 0.011 | 0.098 0.760 |
| years_experience_0 | 0.7374 | 1.157 | 0.637 | 0.524 | -1.531 3.006 |
| years_experience_1 | -0.2845 | 0.254 | -1.119 | 0.263 | -0.783 0.214 |
| years_experience_2 | -0.1667 | 0.219 | -0.760 | 0.447 | -0.597 0.263 |
| years_experience_3 | -0.0004 | 0.212 | -0.002 | 0.998 | -0.417 0.416 |
| years_experience_4 | -0.0320 | 0.304 | -0.105 | 0.916 | -0.628 0.564 |
| years_experience_5 | 0.2982 | 0.206 | 1.450 | 0.147 | -0.105 0.701 |
| years_experience_6 | 0.2757 | 0.403 | 0.685 | 0.493 | -0.513 1.065 |
| years_experience_7 | 0.3683 | 0.360 | 1.024 | 0.306 | -0.336 1.073 |
Model with sklearn’s logistic regression
import sklearn
X = data_dataframe.drop('salary over 90000', axis = 1)
y = data_dataframe['salary over 90000']
skl_logreg = sklearn.linear_model.LogisticRegressionCV(cv = 6)
skl_model = skl_logreg.fit(X, y)
predictions = skl_model.predict(X)

model_confusion_matrix = sklearn.metrics.confusion_matrix(y, predictions)
print("Average cross validation scores: {}".format(sklearn.cross_validation.cross_val_score(skl_logreg, X, y, scoring='roc_auc').mean()))
print("Confusion matrix:\n", model_confusion_matrix)
print("Model performance: \n", sklearn.metrics.classification_report(y, predictions))
print("Area under ROC curve for model: {}".format(sklearn.metrics.roc_auc_score(y, predictions)))
Average cross validation scores: 0.6704394926246255
Confusion matrix:
 [[146 348]
 [ 79 555]]
Model performance:
              precision    recall  f1-score   support

          0       0.65      0.30      0.41       494
          1       0.61      0.88      0.72       634

avg / total       0.63      0.62      0.58      1128

Area under ROC curve for model: 0.5854704402355074
logreg_probabilites_dataframe = pd.DataFrame(skl_logreg.predict_proba(X), columns = ["Probability over threshold", "Probability under threshold"])
model_vs_data_dataframe = pd.concat(objs = [logreg_probabilites_dataframe, master_dataframe[['salary over 90000']]],axis=1)
model_vs_data_dataframe.head()
| Probability over threshold | Probability under threshold | salary over 90000 | |
|---|---|---|---|
| 0 | 0.499859 | 0.500141 | 0 |
| 1 | 0.448430 | 0.551570 | 0 |
| 2 | 0.435767 | 0.564233 | 1 |
| 3 | 0.451176 | 0.548824 | 1 |
| 4 | 0.346364 | 0.653636 | 0 |
skl_logreg_model_coefficients = pd.DataFrame(data = skl_model.coef_, index = ['coefficient'], columns = data_dataframe.drop(labels = 'salary over 90000', axis = 1).columns).T
Part II: Report
Since each company has different data science needs, I expected each job posting’s requirements to vary by a large range. I therefore decided to focus our analysis on a few key pieces of information in each job posting, specifically:
- If the job required a PhD or a bachelor’s degree
- If the job asked for experience with Python
- If the company was likely to be a start-up
- If the job specifically used “scientist”, as a proxy for expectations of technical knowledge
- If the job description mentioned machine learning
- If the job function includes managing or directing responsibilities
- The mean number of years of experience required
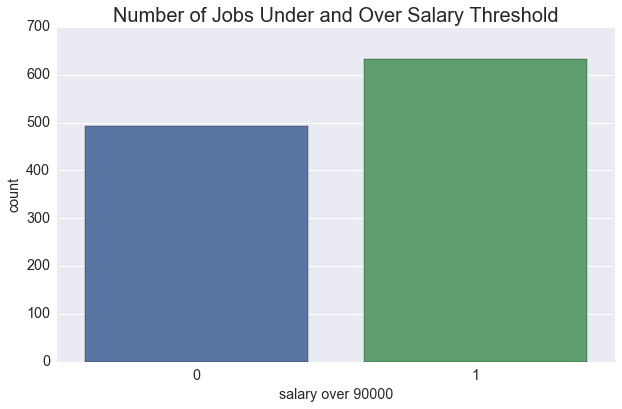
My goal was to predict which jobs will have a salary exceeding $90,000 based on these features. This value was chosen to represent the mean salary of our data, as is shown below. While I’d prefer to predict the salary more exactly, job salaries typically vary according to a number of factors (location, responsibilities, company policies, etc.) which means computing a salary range may be more useful.
print("Ratio of jobs over salary threshold to under salary threshold: {}".format(round(data_dataframe['salary over 90000'].describe()['mean'],3)))
Ratio of jobs over salary threshold to under salary threshold: 0.562
sns.countplot(data = data_dataframe, x = 'salary over 90000')
plt.title("Number of Jobs Under and Over Salary Threshold")
sns.plt.show()
Procedure: Scraping Job Listings From Indeed.com
By a rough estimation, only a fraction of jobs posts explicitly included more that one of these features. Rather than follow the hyperlink for each post and scanning each page, which would likely have formatting particular to each company, I reasoned that I could leverage Indeed.com’s search to obtain information we could not readily access.
Each job posting on Indeed.com has a unique ID. (When capturing the data, we noticed approximately 20% had duplicated IDs. I determined by inspection that these were reposted jobs, and therefore reasonably removed these data points.) For this reason I could employ a strategy where I changed the search query and kept track of which jobs were among the results, perform multiple keyword searches, and merge the resulting data on the for each ID. For example, the following are the first few jobs that required a PhD and mentioned 3 years of experience:
master_dataframe[(master_dataframe['PhD OR ph.d'] == 1) & (master_dataframe['years experience 3'] == 1)][['job title', 'PhD OR ph.d', 'years experience 3']].head()
| job title | PhD OR ph.d | years experience 3 | |
|---|---|---|---|
| 1 | Research scientist, muscle | 1 | 1 |
| 4 | Scientist, cancer cell dependencies, oncology ... | 1 | 1 |
| 13 | Research scientist / 40 / day / bwh - neurology | 1 | 1 |
| 17 | Phd research scientist- machine learning | 1 | 1 |
| 30 | Research data scientist | 1 | 1 |
This method of analysis is much simpler than the most obvious alternative strategy — following each job posting on Indeed.com to its description on an external website and performing a keyword search — but the method relied on Indeed.com’s search algorithm, which introduced complications:
Indeed.com’s support documentation stated that only about 20% of the job postings in a search result include salary information. The search results deliver this information if available; otherwise, the salaries are estimated from past job postings and user-provided data.
The web scraping provided a significant number of results that contained keywords like “data” and “science” but may be unrelated to data science. For example:
master_dataframe[master_dataframe['Lab OR laboratory'] == 1]['job title'].head()
2                         Cellular analytics scientist
3                         Cellular analytics scientist
4    Scientist, cancer cell dependencies, oncology ...
5    Scientist, cancer cell dependencies, oncology ...
6    Scientist, cancer cell dependencies, oncology ...
Name: job title, dtype: object
An inspection of a sampling of the potentially unrelated jobs suggested that job postings that referred to a laboratory were more likely to focus on biology or related sciences. Similarly, job postings with titles that included “software engineer” were less likely to relate to data science. These keywords were used to filter these jobs from the data.
Results and Analysis
The results are not be current since they were drawn from non-static webpages.
I analyzed postings for 1692 jobs. I removed 564 observations from the data, a 33.3% reduction, leaving 1128 observations. “Scientist” was by far the most common keyword, occurring in approximately 75% of observations, followed by PhD, “laboratory”, and bachelor’s degree (36%, 29% and 28%, respectively).
print("Jobs analyzed: {}\nJob postings removed: {} ({}% change)\nRemaining postings: {}".format(master_dataframe.shape[0], master_dataframe.shape[0] - data_dataframe.shape[0], round(100 * (data_dataframe.shape[0] / master_dataframe.shape[0] - 1),1), data_dataframe.shape[0]))
print("\nKeywords\t\tFrequency\n{}".format(master_dataframe.drop('salary over 90000', axis = 1).describe().loc['mean'].sort_values(ascending = False)))
Jobs analyzed: 1692
Job postings removed: 564 (-33.3% change)
Remaining postings: 1128

Keywords		Frequency
Scientist                0.791962
PhD OR ph.d              0.372340
Lab OR laboratory        0.336879
Bachelors OR BS OR BA    0.217494
Python                   0.211584
Manager OR director      0.196809
Machine learning         0.167849
years experience 5       0.132388
years experience 3       0.131797
years experience 2       0.119385
Startup OR start-up      0.091017
years experience 1       0.085106
years experience 4       0.059102
Software engineer        0.048463
years experience 7       0.043735
years experience 6       0.033097
years experience 0       0.007092
Name: mean, dtype: float64
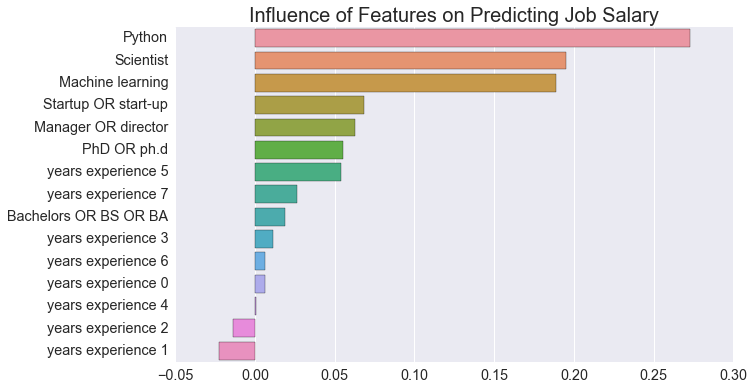
Of the keywords examined, Python, Scientist and Machine Learning were the strongest predictors of a job’s salary.
skl_logreg_model_coefficients.sort_values(by = 'coefficient', ascending = False)
| coefficient | |
|---|---|
| Python | 0.273112 |
| Scientist | 0.195354 |
| Machine learning | 0.188584 |
| Startup OR start-up | 0.068621 |
| Manager OR director | 0.062443 |
| PhD OR ph.d | 0.055231 |
| years experience 5 | 0.053895 |
| years experience 7 | 0.026132 |
| Bachelors OR BS OR BA | 0.018832 |
| years experience 3 | 0.011098 |
| years experience 6 | 0.006221 |
| years experience 0 | 0.006133 |
| years experience 4 | 0.000689 |
| years experience 2 | -0.013593 |
| years experience 1 | -0.022556 |
plt.figure(figsize=(10,6))
sns.barplot(data = skl_logreg_model_coefficients.sort_values(by = 'coefficient', ascending = False).T, orient='h')
plt.title("Influence of Features on Predicting Job Salary")
sns.plt.show()
Conclusion
Python, Scientist, and Machine learning were the strongest predictors of salary. However this may be because these keywords are better correlated with data science roles; therefore, these keywords could be predicting a certain class of job from others which tend to have different corresponding salaries. (E.g., a data scientist is typically paid more than a data analyst.)
The model’s precision was likely impinged from the variability in Indeed.com’s salary estimates. If given more time, one could measure this variability by comparing job postings where the salary is explicitly stated to those with estimated salaries.