I merged production and weather data and employed time series analysis and machine learning techniques to model global coffee prices. I used this model to forecast prices through July 2017.
Introduction
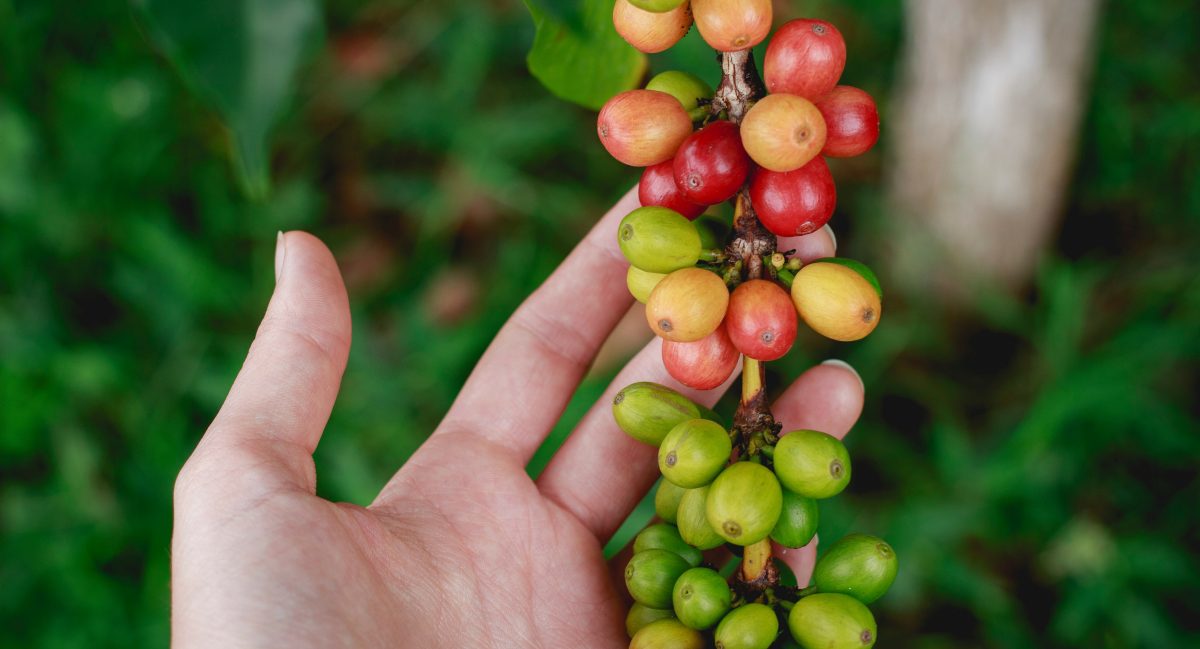 Coffee beans are actually seeds from coffee cherries, which grows on a shrub or small tree that is native to Ethiopia. Nearly all coffee beans come from two species — Arabica and Robusta. Arabica is usually considered the premium and more flavorful coffee, but robusta is cheaper and still gets the job done, where caffeine is concerned. Robusta also tends to make a nicer head of foam on espressos, making it more popular in Italy.
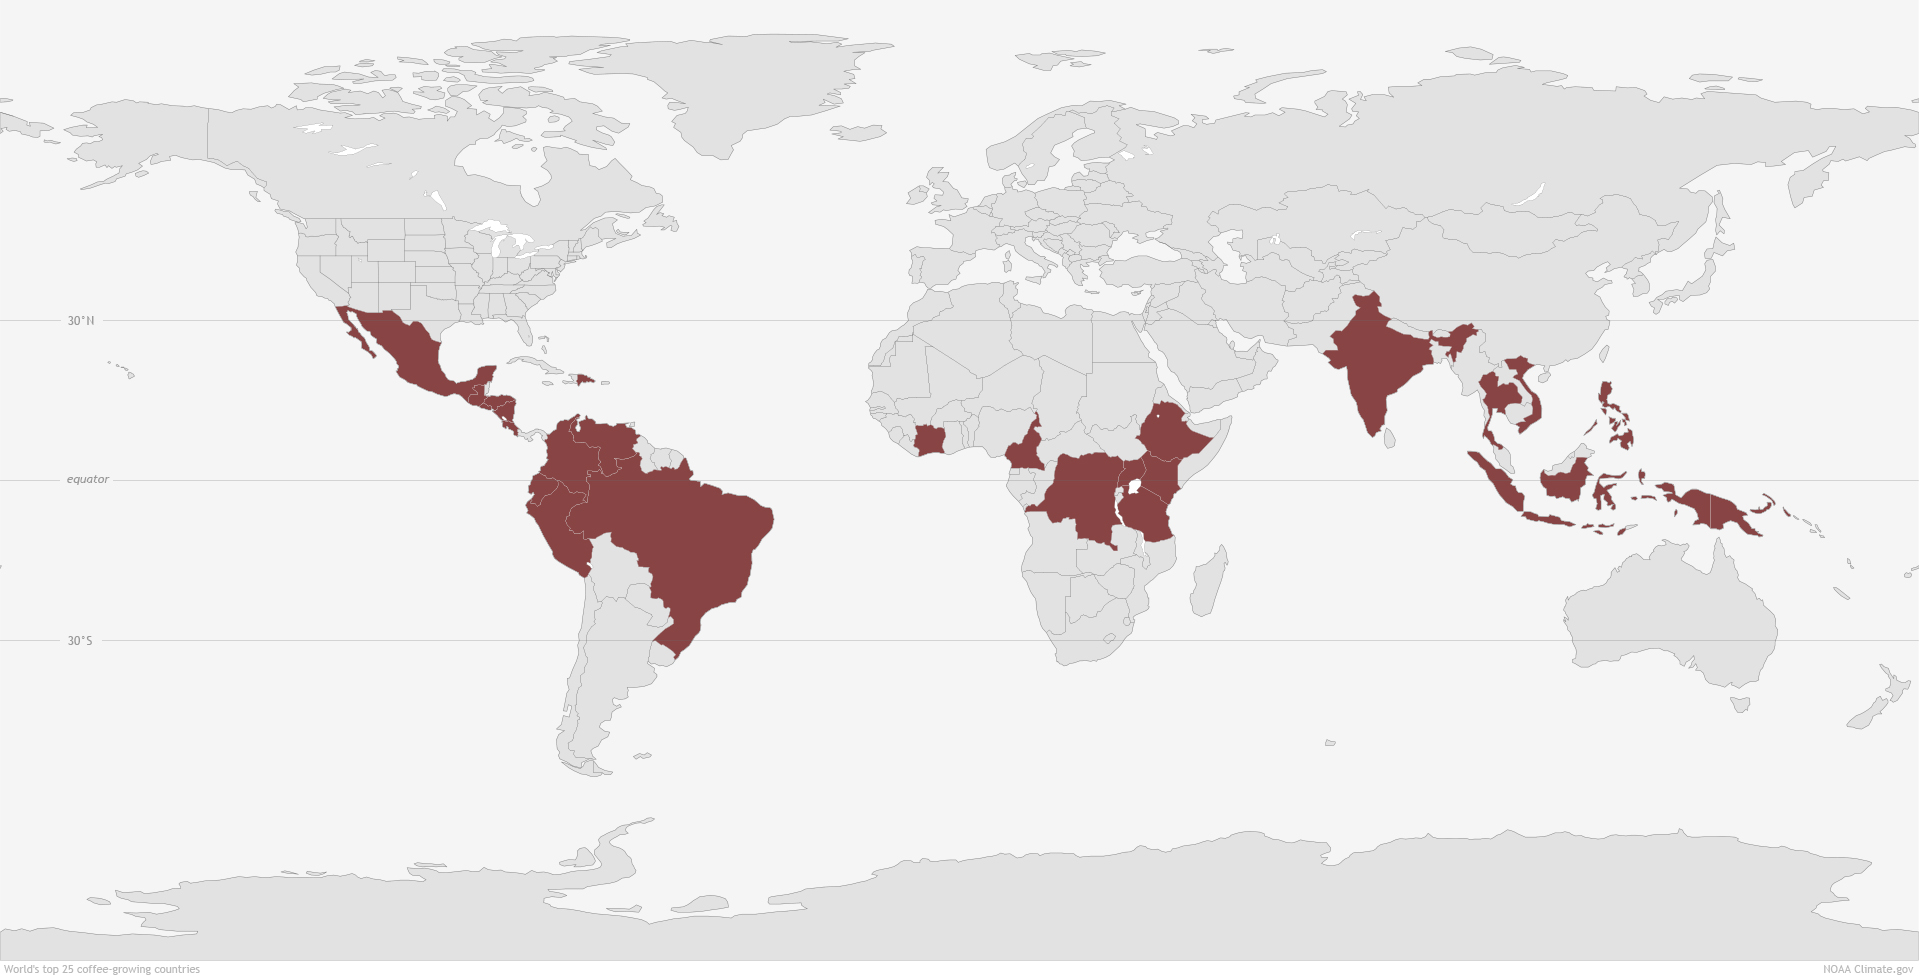 Coffee plants grow best in latitudes between 25° north and 30° south. This is called ‘the Coffee Belt’ or ‘The Bean Belt’. Arabica plants are a little fussy, and prefer higher elevations with rich soil, while robusta likes warmer regions at lower altitudes.
Coffee is an important cash crop in the world, but prices can be a volatile. That’s a problem, if you’re a country interested in taxing those revenues or in the economic well-being of your farmers. Coffee-producing countries collaborated with the UN to try to fix this problem in 1962. They created the International Coffee Agreement, which set up an exports quota system to help stabilize prices, and the International Coffee Organization, to help regulate this system, promote the spread of industry knowledge, and improve economic conditions for farmers.
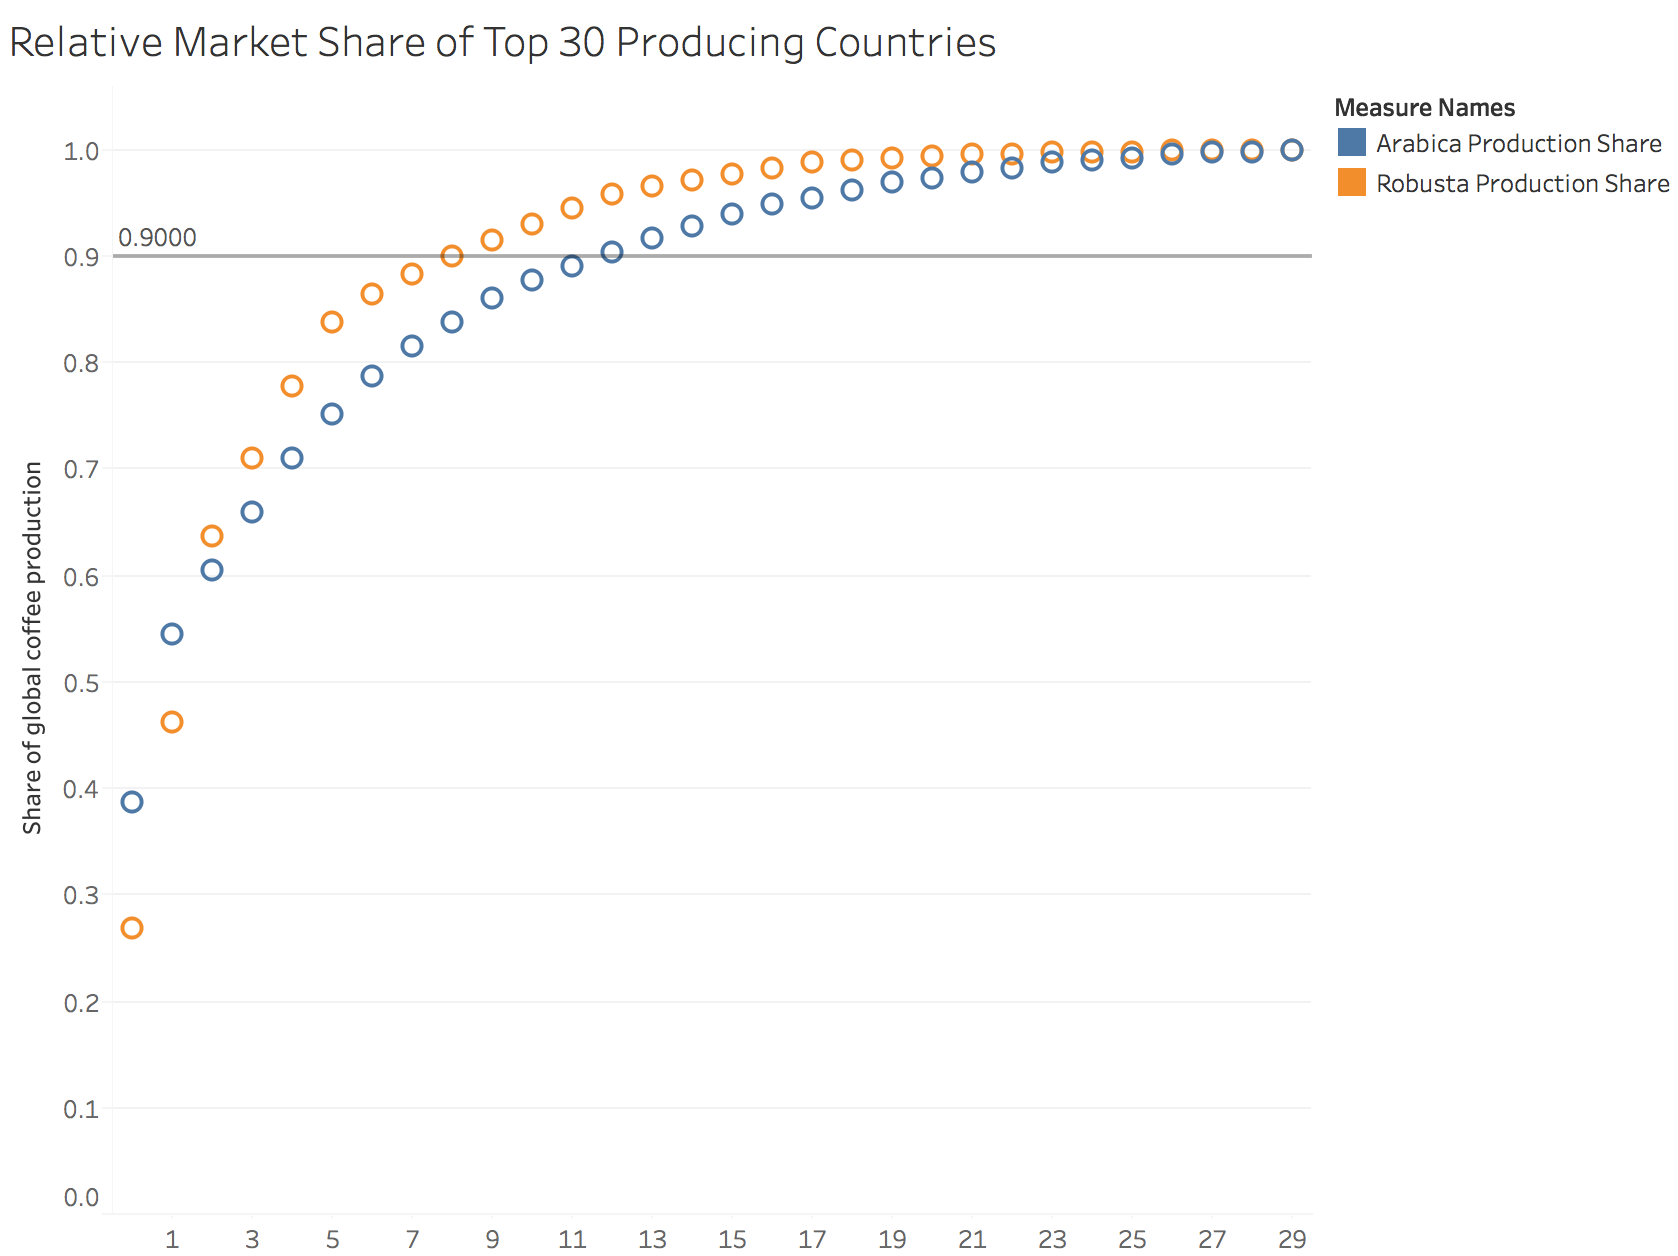 Today the ICO has 73 member countries, which together represent 98% of global coffee production and 83% of its consumption. But not every country produces the same amount. This chart shows that about a dozen countries produce the world’s supply of arabica coffee beans, and less than 10 countries for robusta. (In fact, in the period I analyzed, Brazil produced about 39% of all arabica beans, and nearly one-fifth of all robusta beans.)
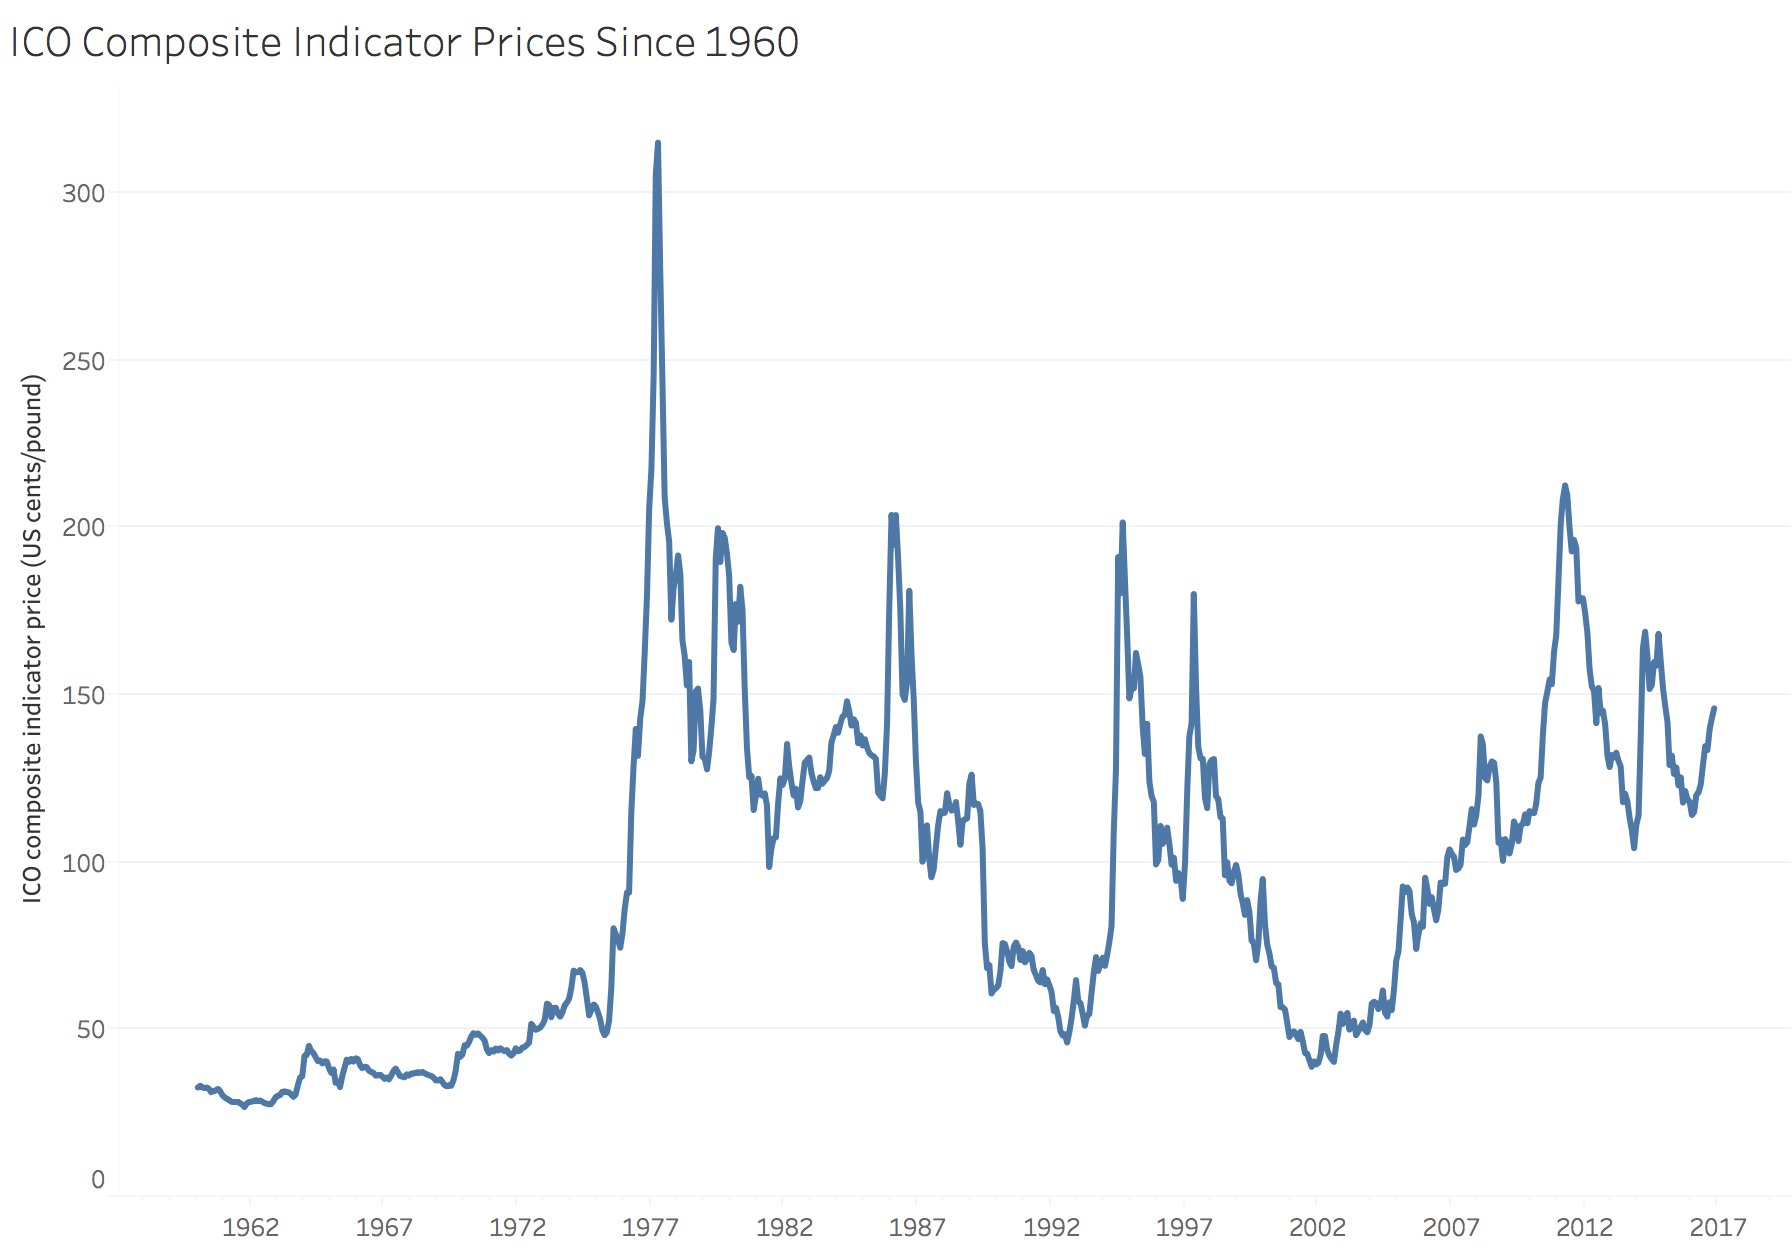 The ICO also tracks and publishes export data from its member countries. This is a chart of the ICO composite indicator price, which is a weighted average, and is considered a benchmark for global coffee prices. It won’t tell you how much Dunkin’ will charge you tomorrow, but it could be important to know if you’re a grower that needs to brace for an upcoming price slump, or if you’re a large corporation like Starbucks that purchases coffee through futures contracts on the commodities market. This is what I modeled.
There are a few things to note about the prices though. First, price spikes are often caused by frosts in Brazil, like in 1975 (and the ‘76 harvest), and 1981, and 1994. Other causes include low inventory levels like 1997, or a combination of poor harvest and increasing demand, like in 2011.
But some points mark changes in the coffee trade itself: in 1973, the quota system set up by the ICA collapsed. It was temporarily reinstated in 1976 before finally disappearing in 1989. This means that all data after 1990 reflect free-market pricing, whereas data before then is a mix of free-market and artificially stabilized prices. Therefore, to use consist conditions, I looked at data 1990 and later.
You remember that there were some large price spikes caused by frosts in Brazil. In fact, volatility levels are generally highest in May through August, when it’s winter in the southern hemisphere. Frosts can damage crops, or even kill plants and disrupt harvests for the next 3-5 years. I wanted to try capturing that in the model, so I used temperature data taken from stations spread around the world to estimate the risk of frost.
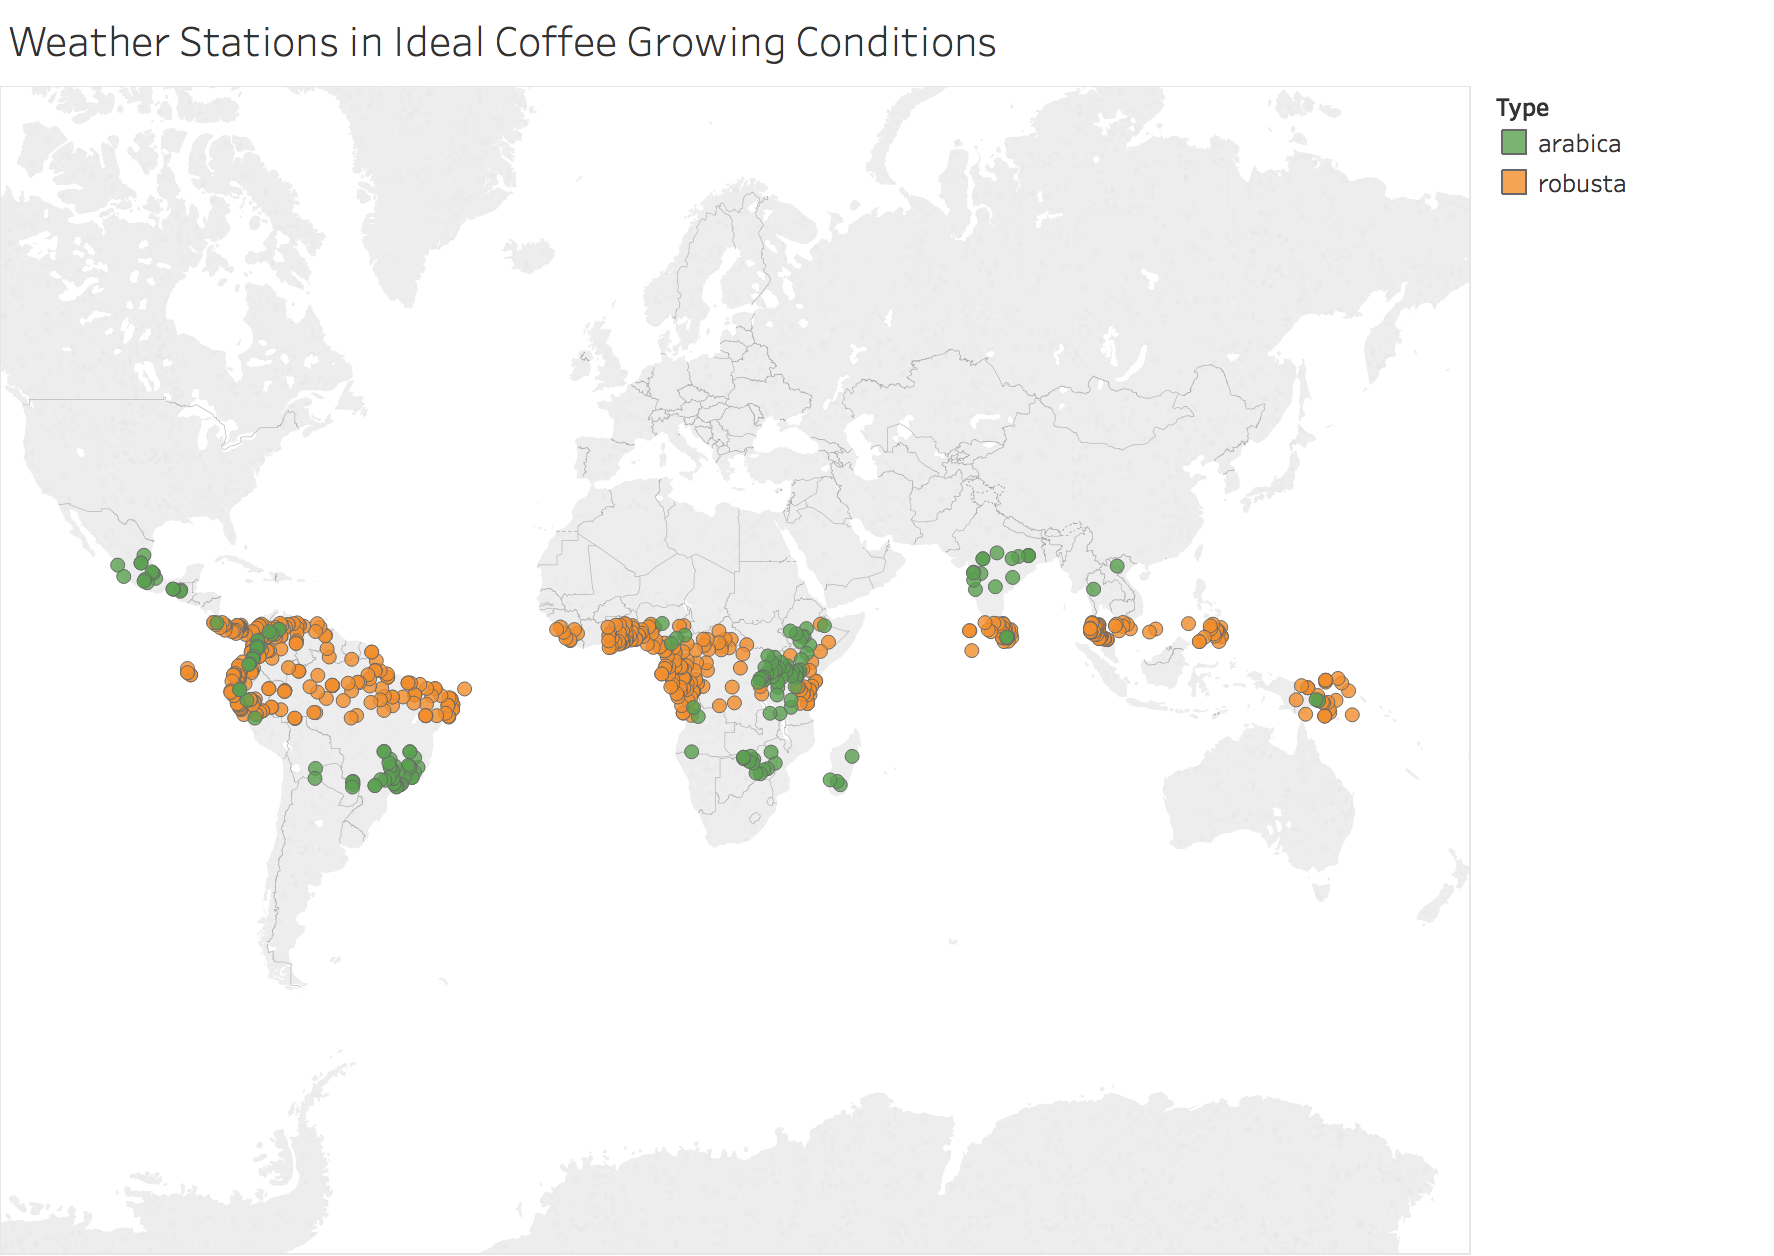 This data came from Berkeley Earth, an independent organization that tracks global temperatures and merges and cross-validates 16 datasets. These dots represent the weather stations in the data that are located in latitude and elevation sweet spots for each species. There is no apparent method for quantifying frost risk, so I approximated it by
 risk = T^-2, where T is the minimum monthly temperature in degrees Celsius.
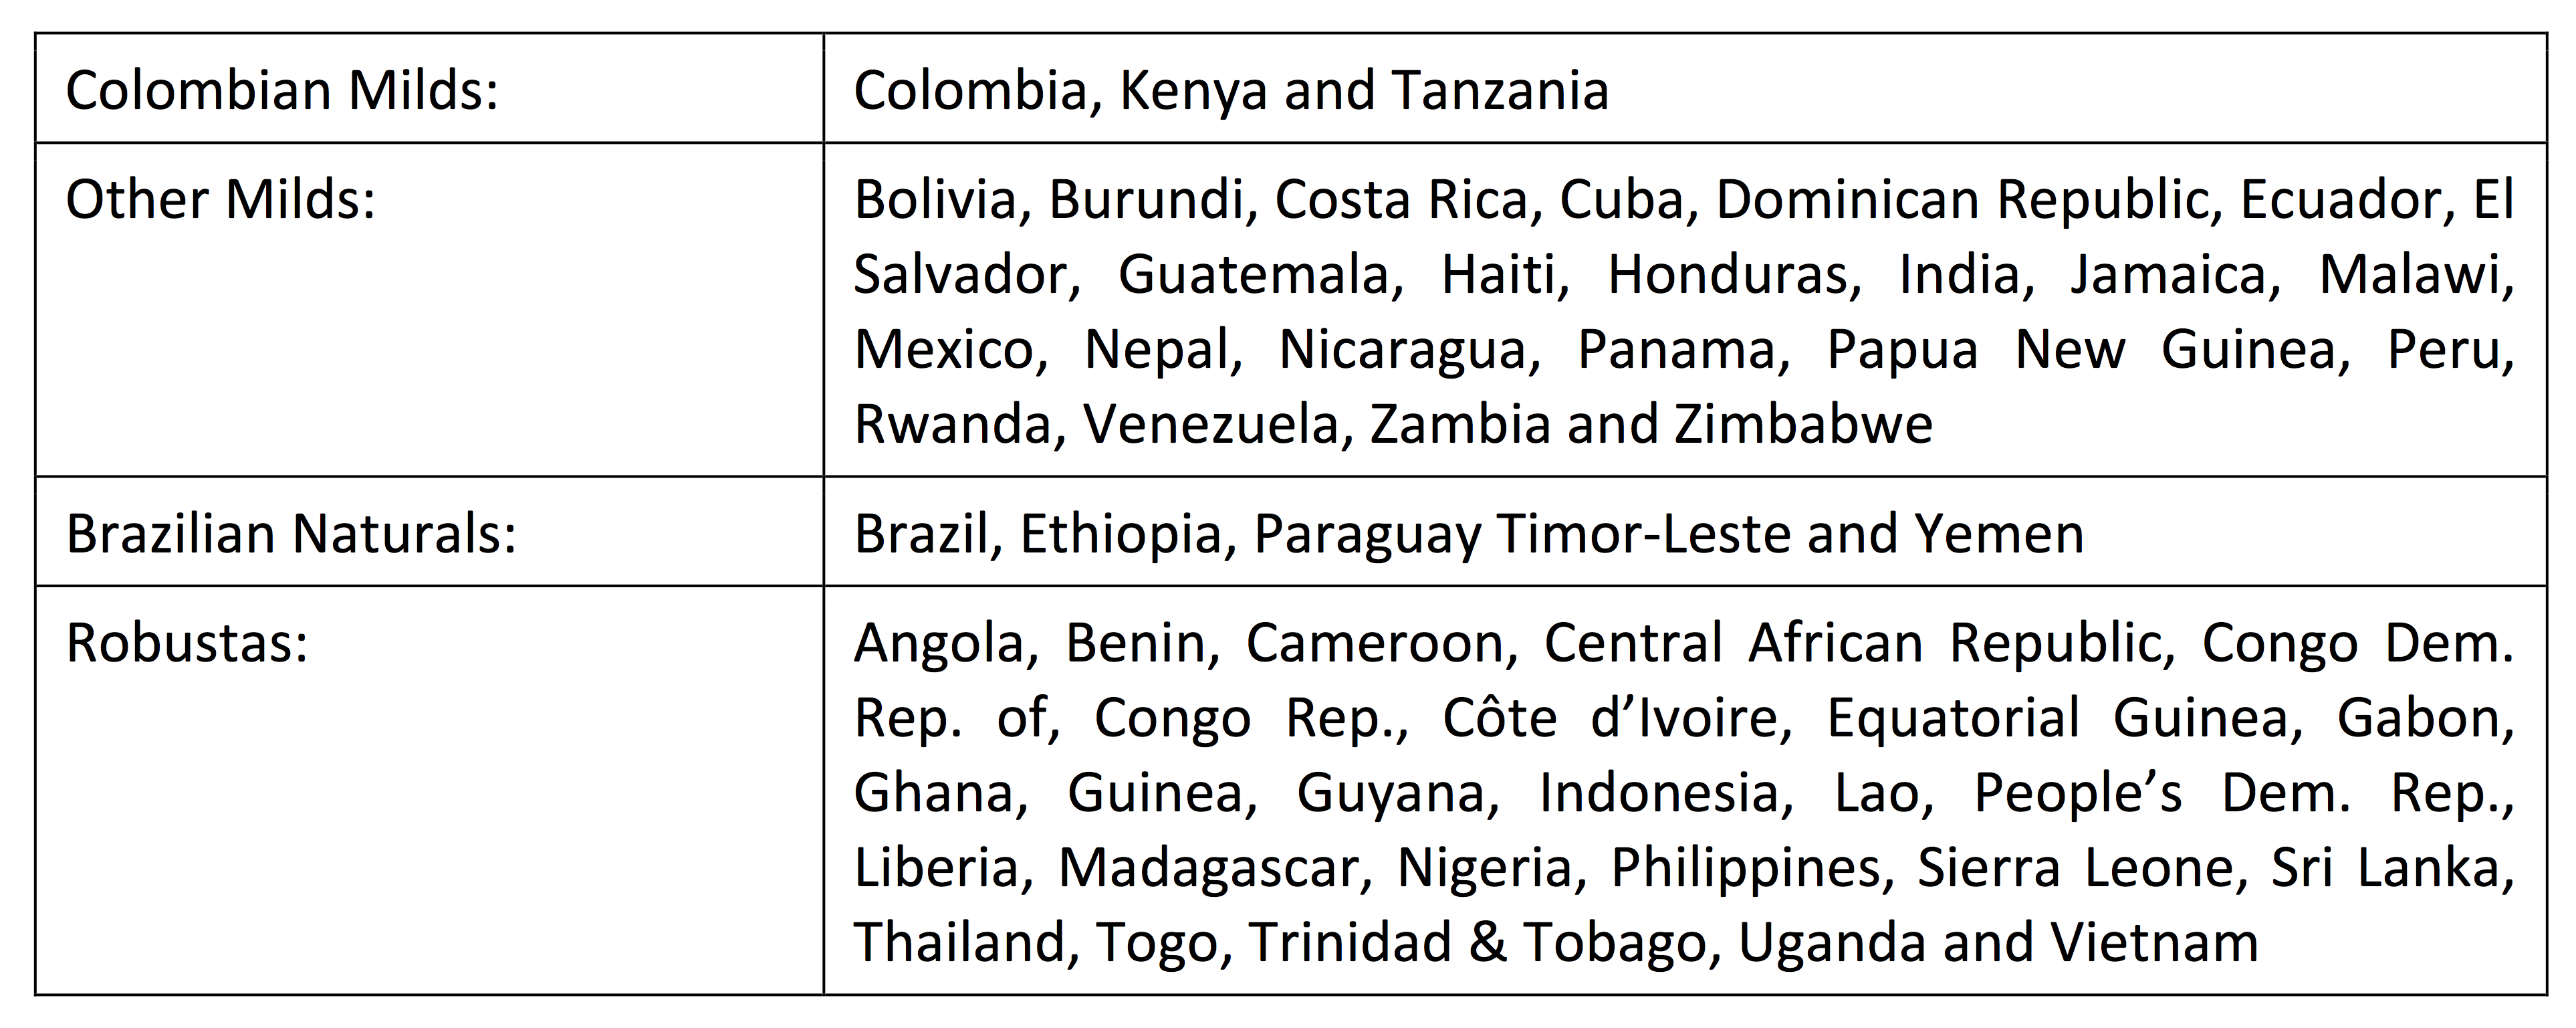 When aggregating its data, ICO groups producing countries into 4 categories, based on the main export for each country and how the coffee is processed. To simplify my model, I examined data from the top 5 producers of each species, a list of 9 countries (since Brazil is in both), which captured 73% of arabica and 78% of robusta global exports.”
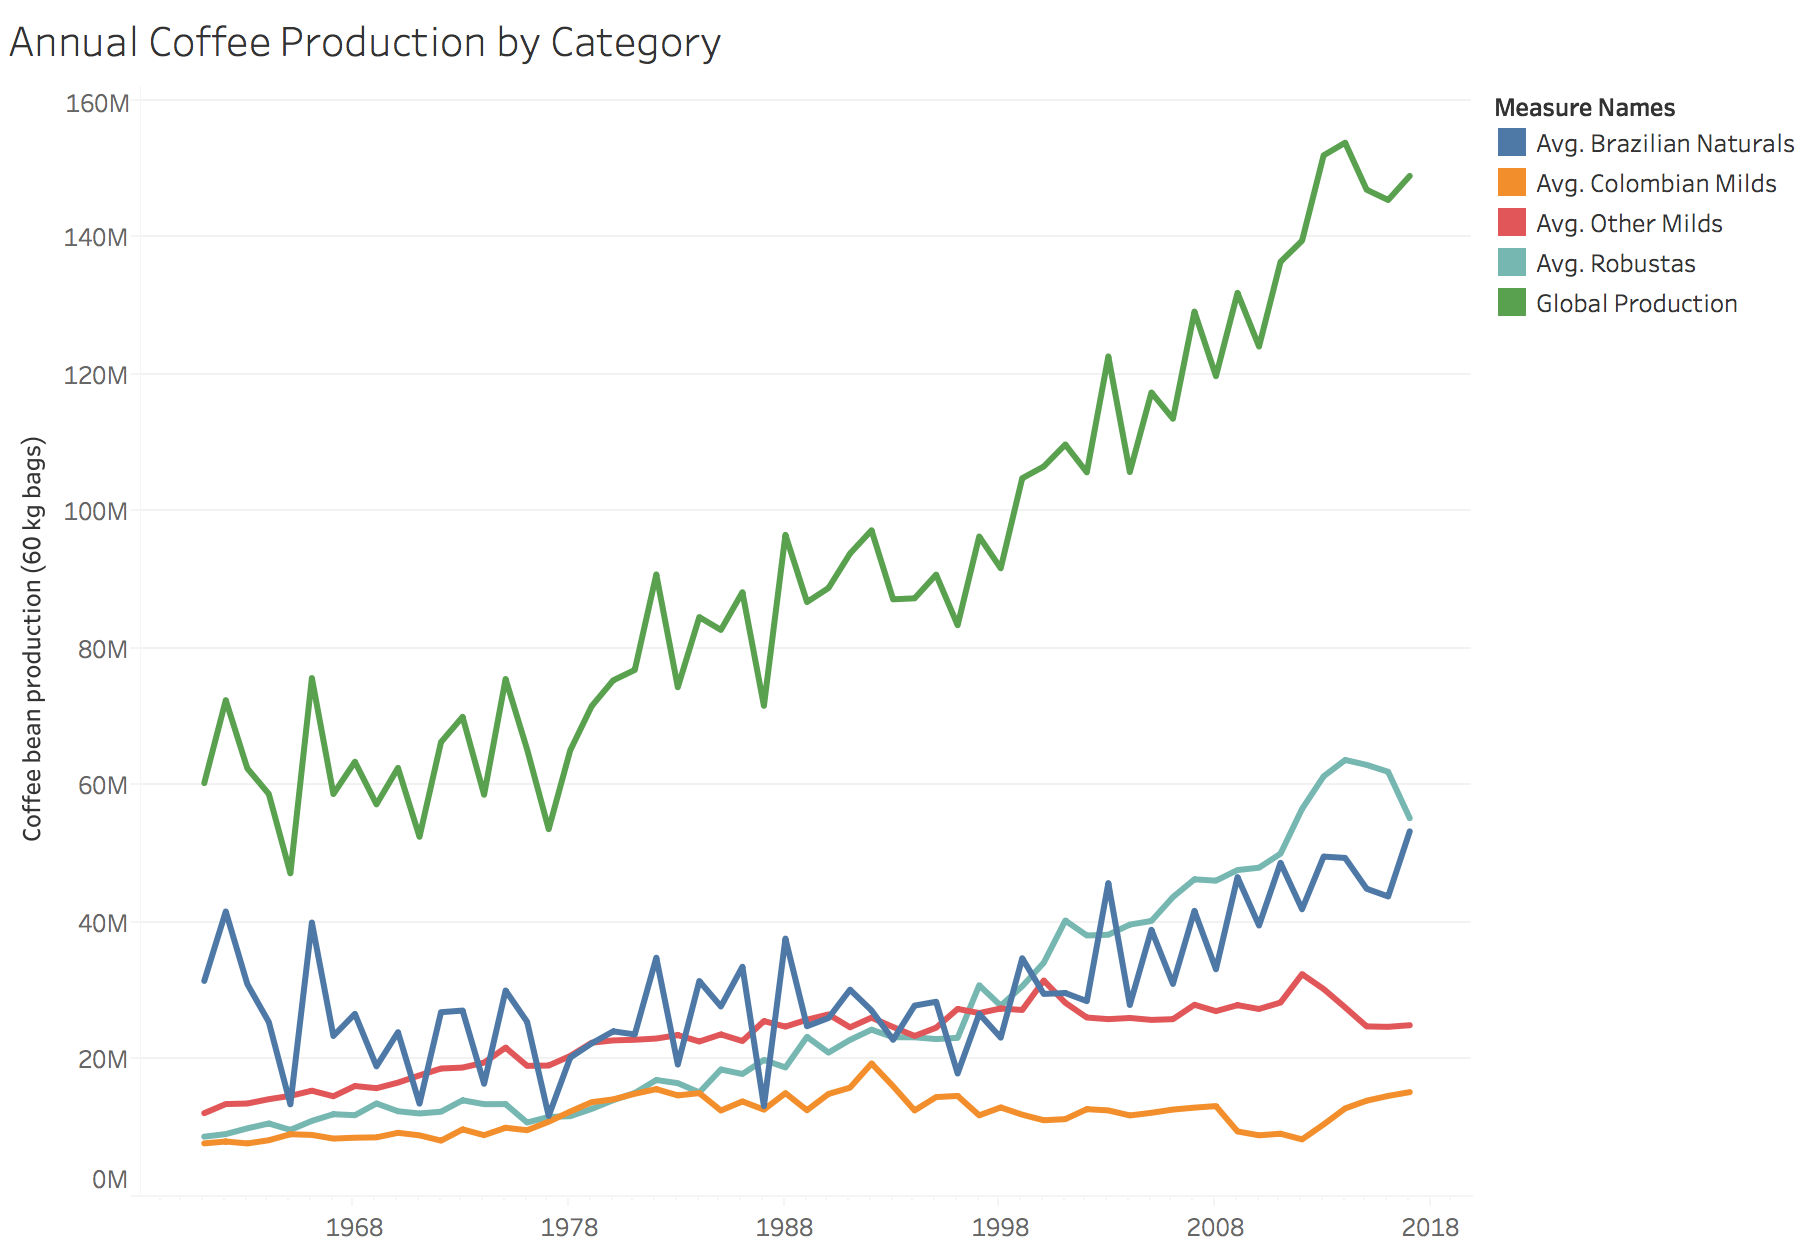 In addition to frost risk, I also wanted to include the amount each country produced the previous year, and the amount each country held in inventory (also called ending stocks). I incorporated data from the USDA’s Foreign Agricultural Service. The FAS has specialists stationed all around the world, providing figures are validated and balanced.
This chart contains data going back to 1960, but remember, my model only looks at 1990 on.
Also, just an interesting side note, you can see the Brazilian Naturals category has a lot of variability. That’s because coffee plants grow cherries every other year. This effect is averaged out in every other country except for Brazil, so it has on-years and off-years.
Data Preparation
I imported the data and performed standard data cleaning and formatting, like converting certain strings into datetime values. Only three things stand out in the processing phase: first, filtering the weather stations based on their latitude and elevation, as described above. Second, Berkeley Earth records days using a decimal notation (e.g., 2005.067) which I had to change into a usable format (2005.067 = 2005 + (25 - 0.5)/365 = January 25, 2005). Third, I had to convert the annual production data to compare it to the other data, which was monthly. I did this by filling the gaps with the previous recorded value, a technique called padding or forward-filling.
Modeling
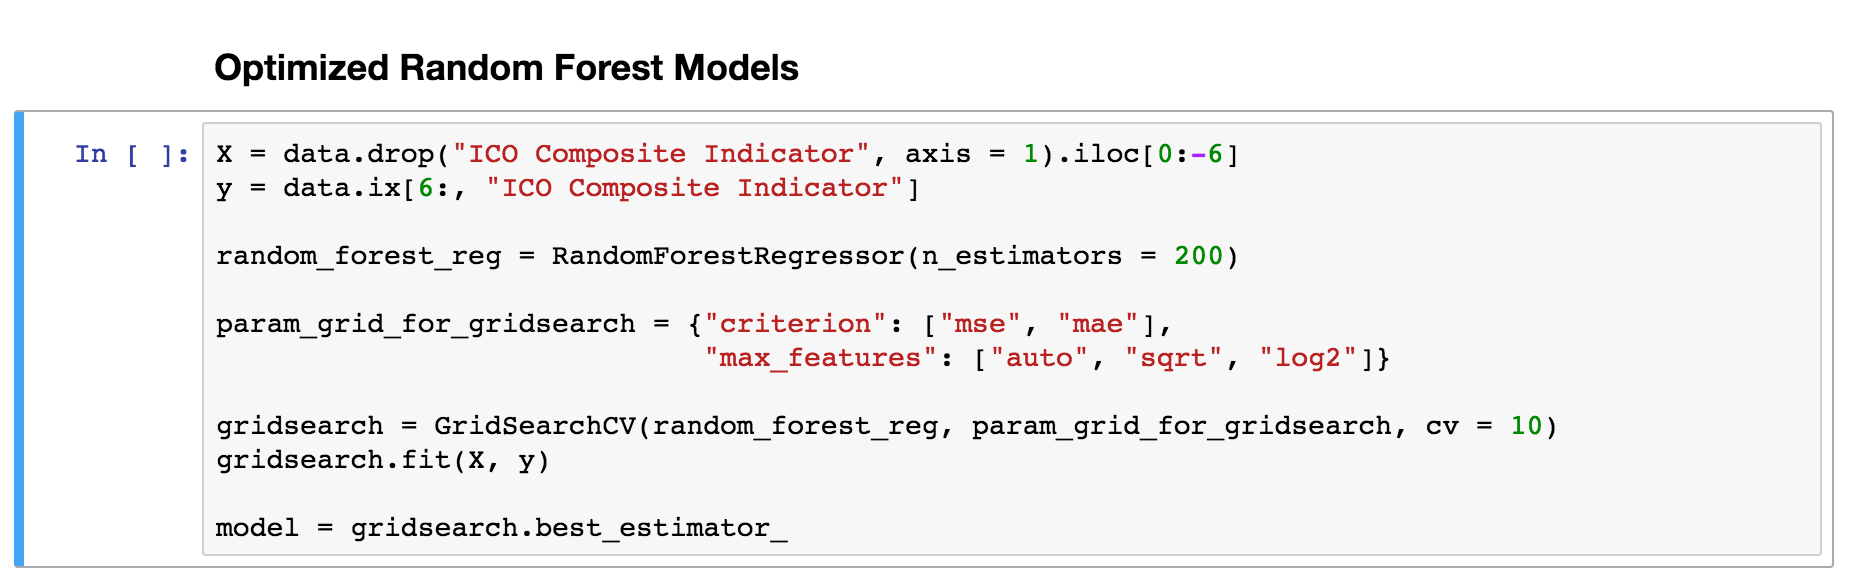 Here’s a quick technical slide describing the model. I tried a few methods, like standard linear regression, but a random forest regressor seemed to fit the nature of the data best. Random forests model the data by building decision trees and randomly removing features to minimize overfitting. I also used a large number of trees and cross-validation, which are also ways to minimize the chances of overfitting, and minimizes errors when I show new data to the model.
Now, the results
Results and Discussion
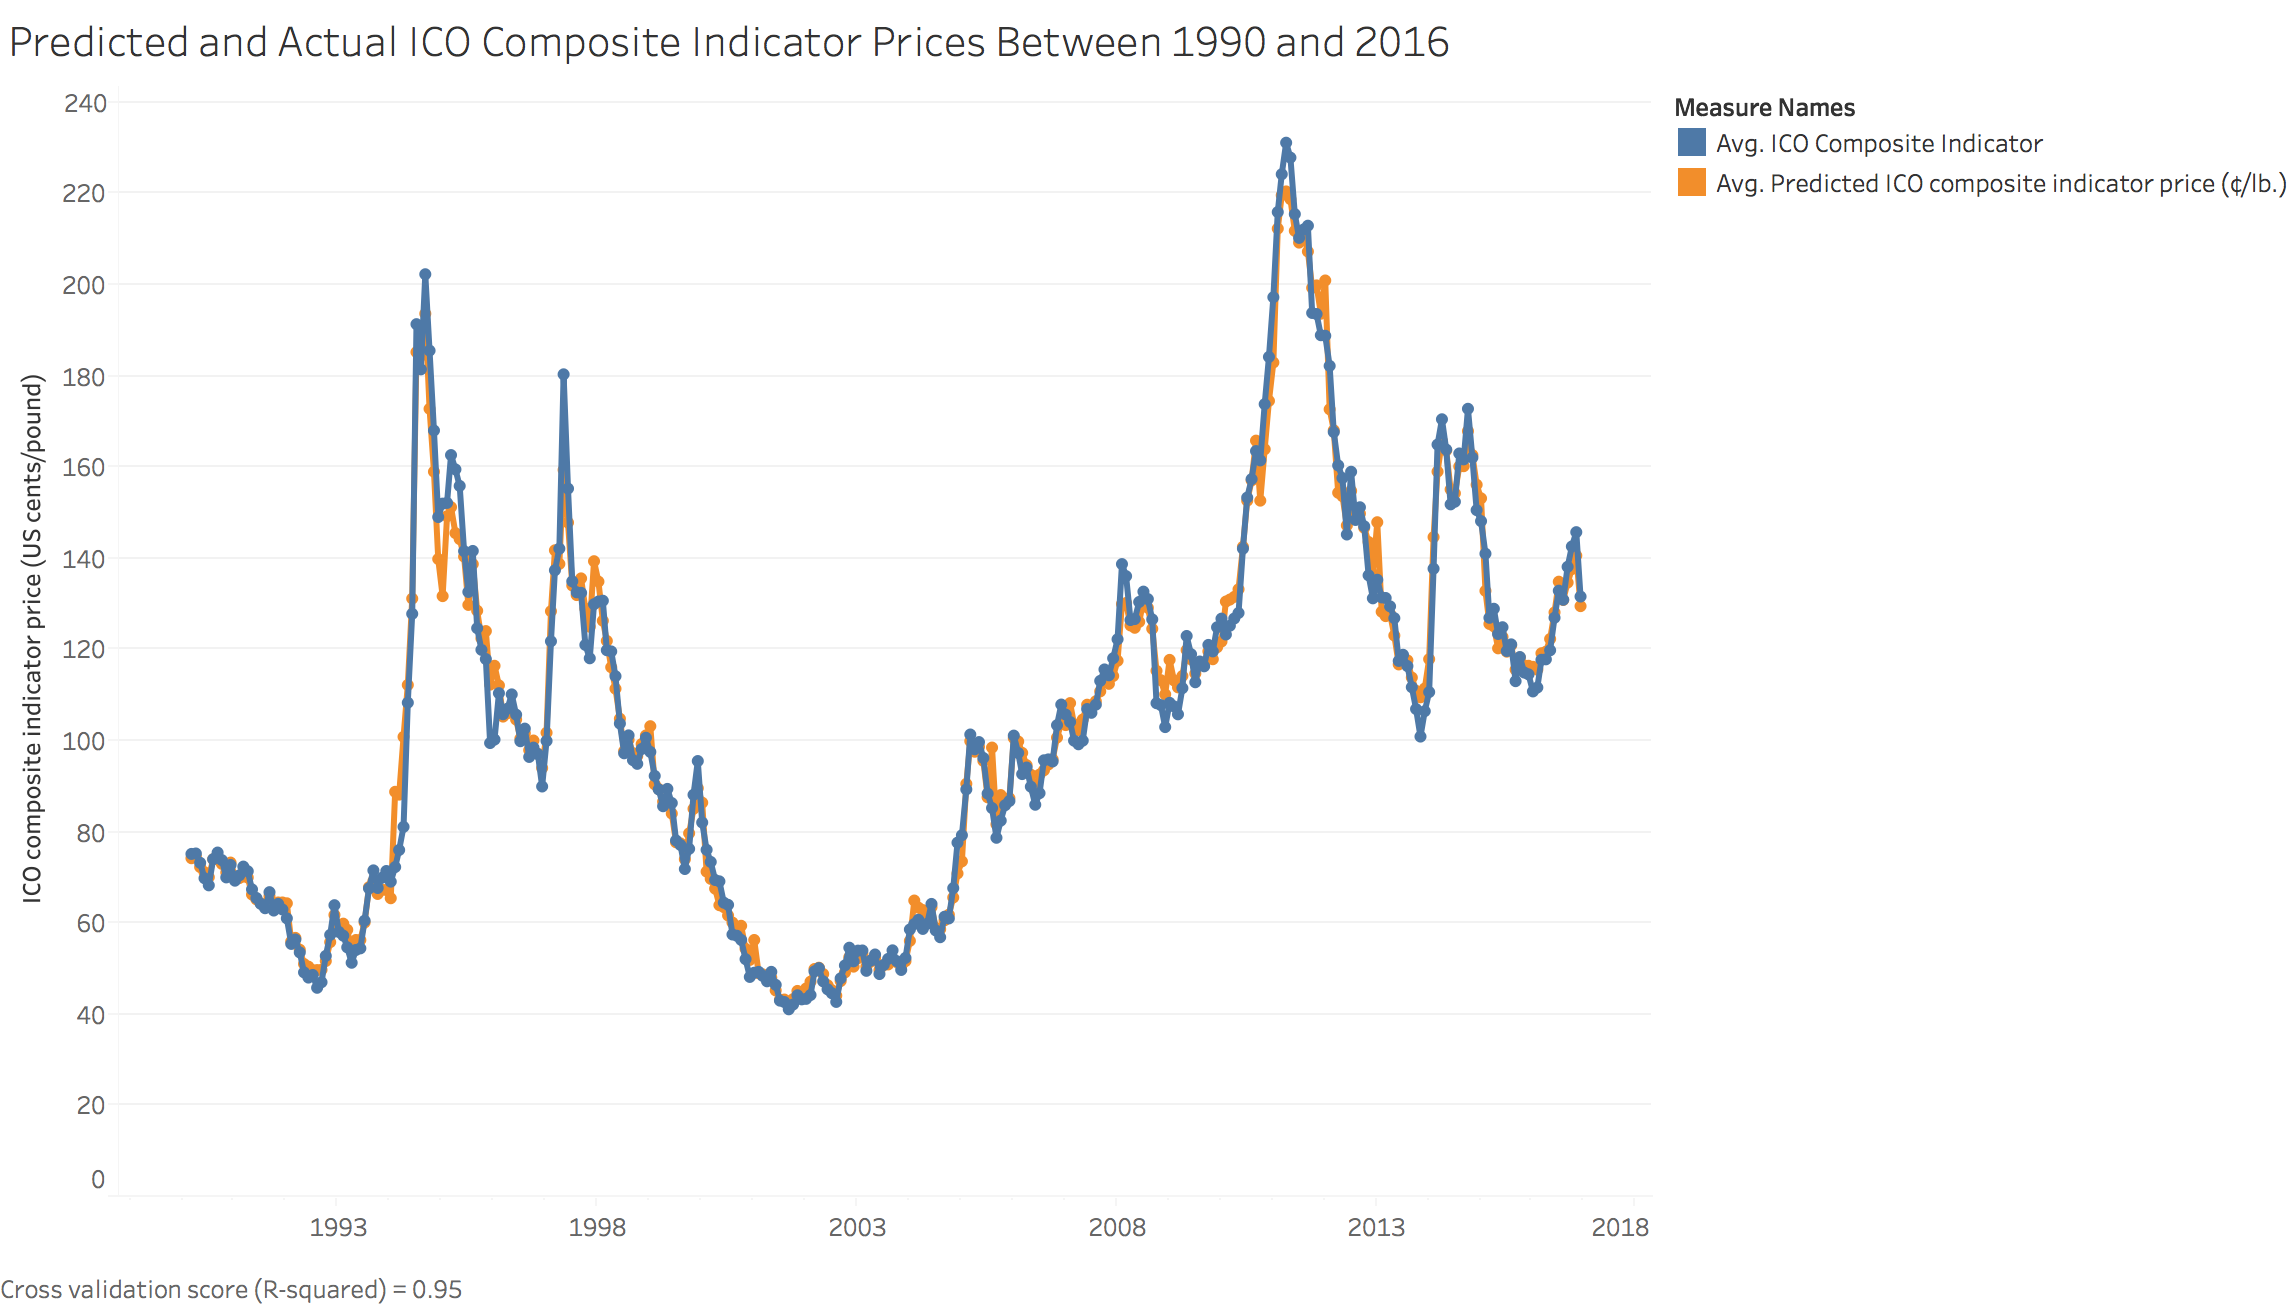 Here is a plot of my model and the actual indicator prices between 1990 and 2016. It’s not easy to see because even after cross validation the model achieved 0.95 R2, which is a measure of goodness of fit.
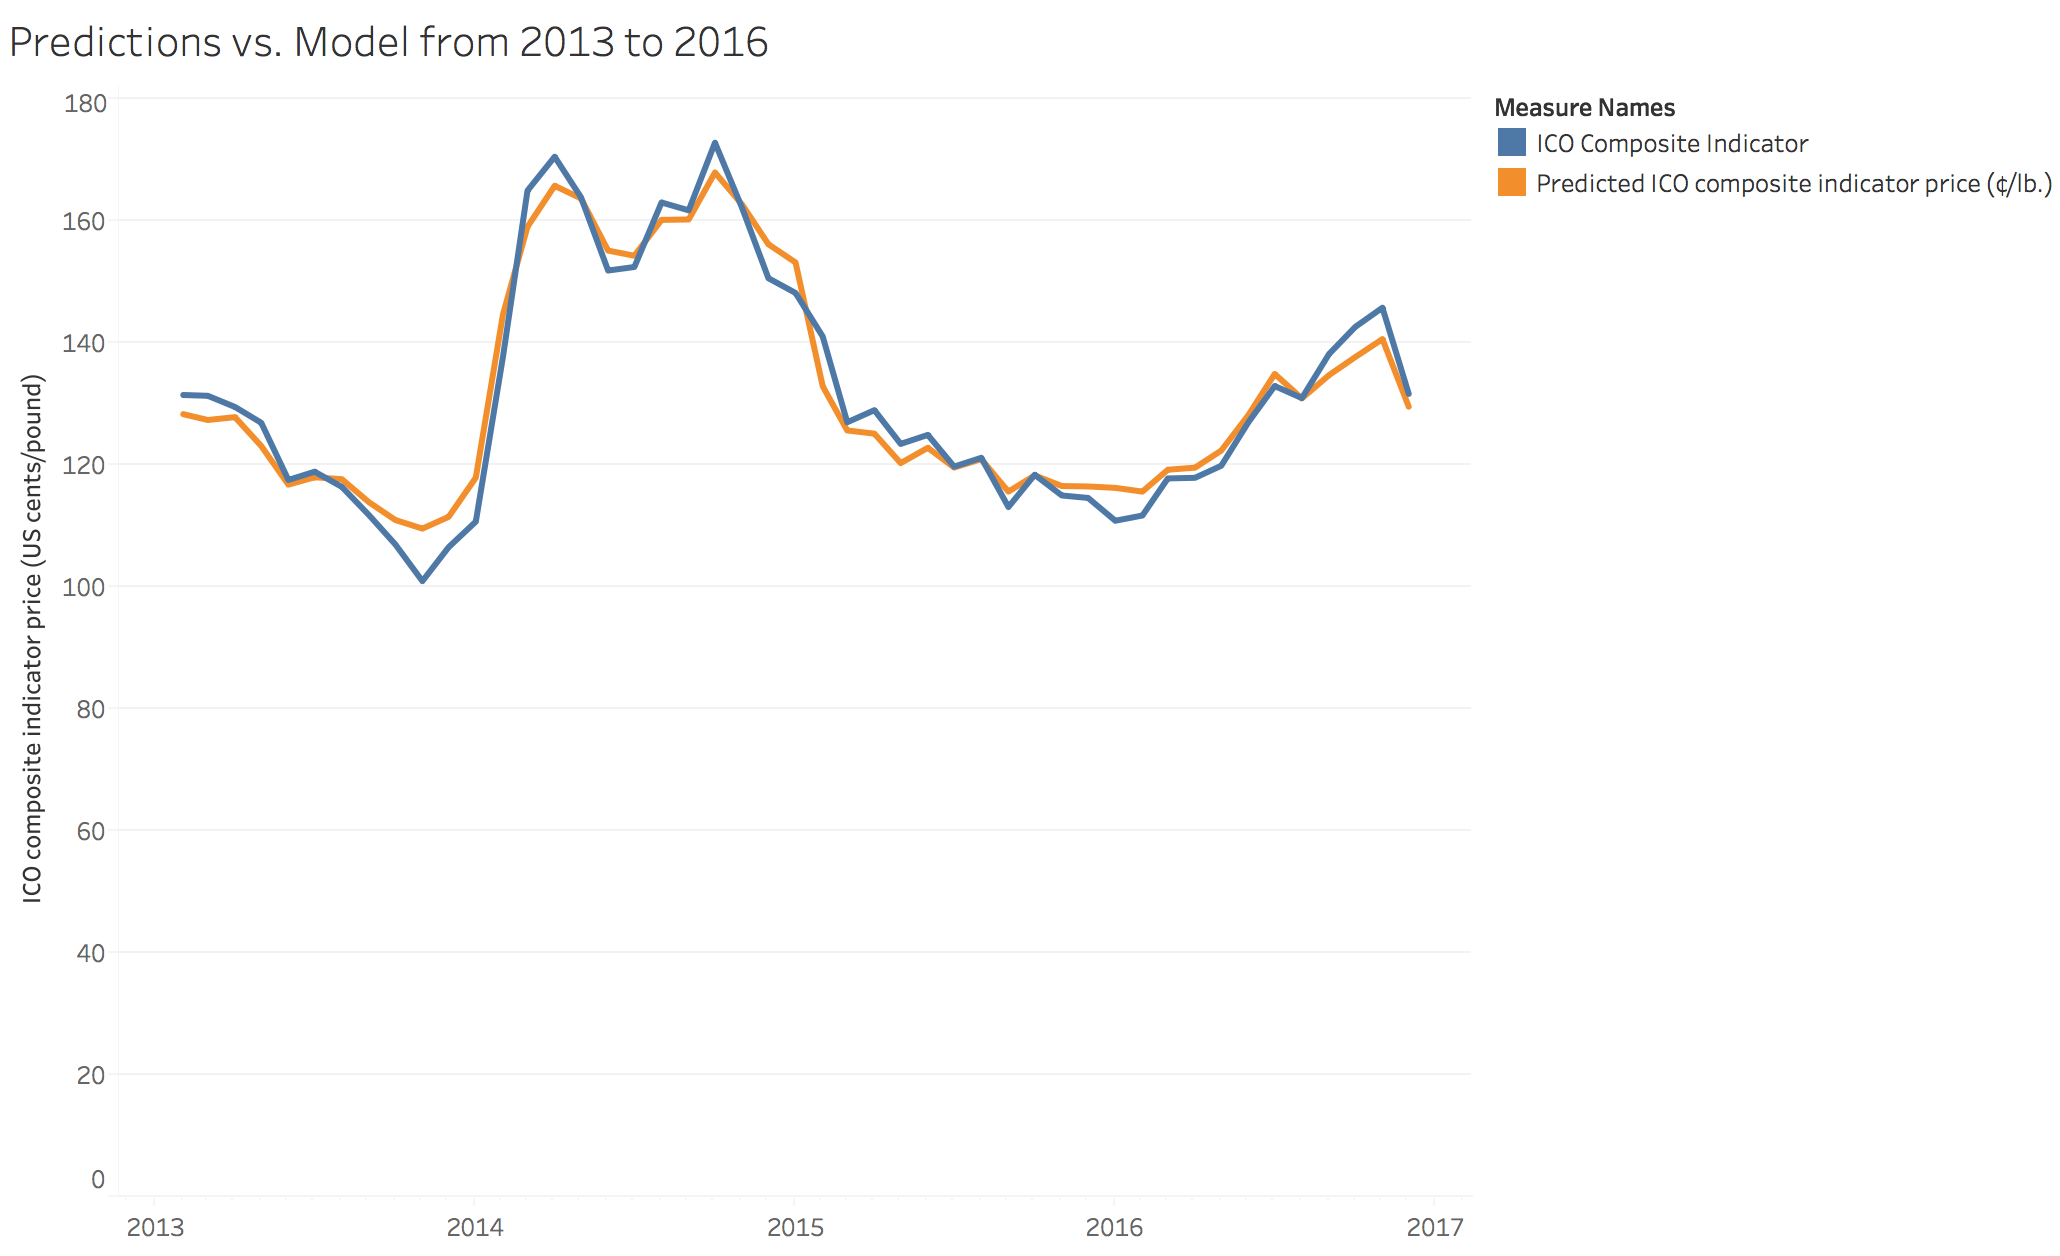 This is a zoomed-in view of the previous plot to show the last three years.
It looks great, but I must be cautious when interpreting my model’s accuracy. Having only 27 years of data limits the number of price spikes it captures. It can also cause a dimensionality problem, and makes it more likely that the model is overfitting. On the other hand, using ensemble methods like random forests tend to lower generalization error (which error found caused by introducing new data), and using cross validation reduces this error further.
Using the previous year’s data automatically brings in a lot of information about the state of the farms, especially any large changes like an increase (or decrease) in the number of fruiting plants. And any weather-driven anomalies are relatively infrequent.
The model results also suggests another interpretation, which comes from the fact that the coffee sector generally changes slowly. Coffee seedlings take 3-5 to bear fruit, and each plant lasts for about 25-40 years. This makes coffee production inelastic to short-run price changes: for example growers cannot quickly produce more to take advantage of spikes in prices, leading to a slow ramp-up in production, and neither can they adjust to overproduction (and price drops), or drops in consumption (such as recessions in principal consuming countries). This means that coffee prices tend to follow simple supply-demand economics.
Next Steps
If I had more time, I would love to collect more data. The ICO provides access to monthly production data, but the cost is out of this project’s budget. (Basically, as a student, I wanted to do everything as close to $0 as possible.)
There are also a number of other factors that affect prices which I haven’t accounted for, which I’d like to include:
- Precipitation, to indicate drought or flooding.
- Spread of diseases like coffee rust, or pests like the coffee cherry borer.
- The financial conditions for the farmers, as crops may be unharvested or abandoned if it is not an economically feasible enterprise for the growers.
Finally, as of writing this, I haven’t found a good way to add confidence or prediction intervals to a model in Python. This may be a better application for a R, the second-most popular programming language in data science, which can perform more sophisticated statistical analysis for time series.
But wait … What about your latte?
That I can’t directly answer. While the model suggests raw coffee will become more expensive over the next few months, how much companies charge consumers depends on their internal business decisions. For example, while researching for this project, J.M. Smuckers announced it would increase its ground coffee prices by an average of 6%. Smuckers own brands like Folgers and Cafe Bustelo, and also is licensed to sell Dunkin Donuts brand ground coffee.
But what I can do is …
Forecast
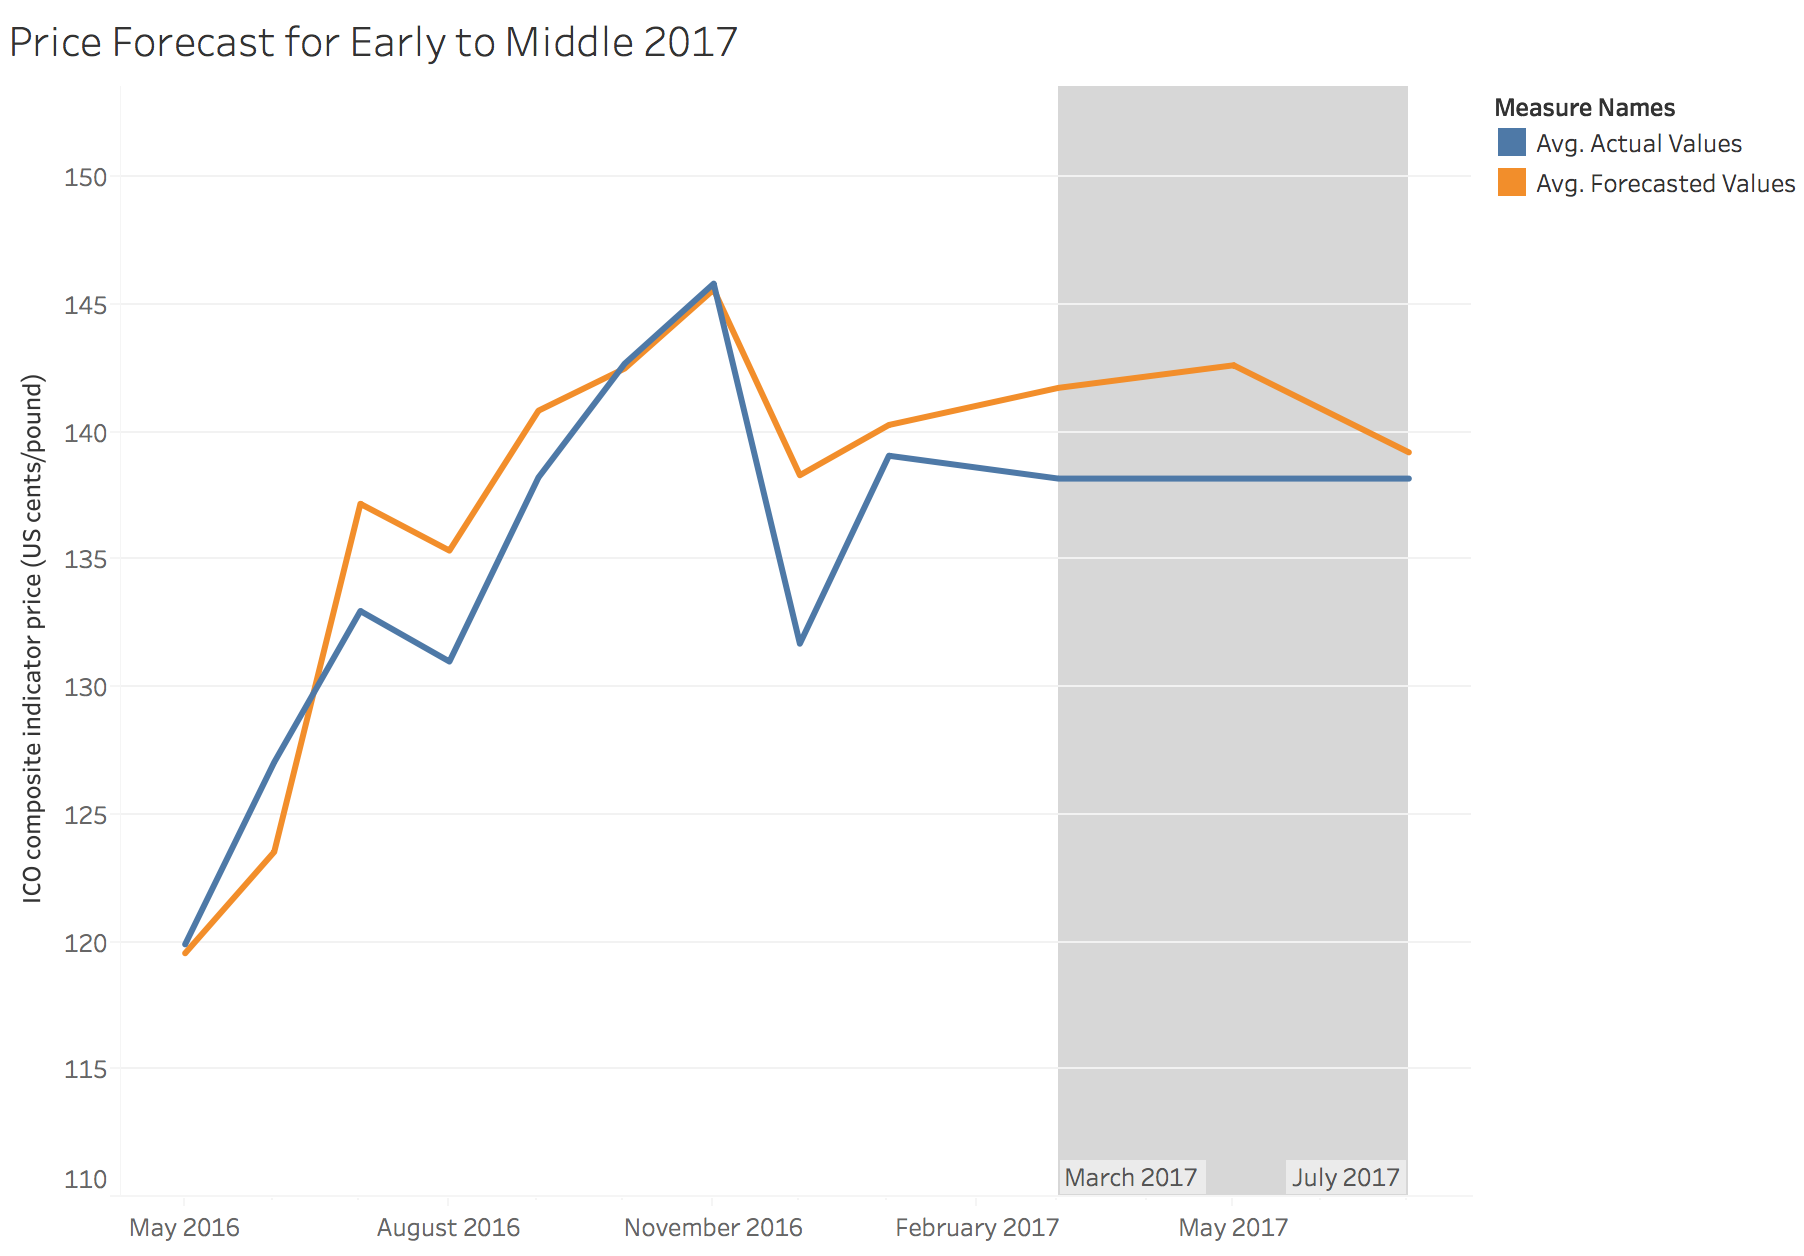 The model is at least directionally accurate, so I wanted to see what the next few months might look like. This is how prices could change in the first half of 2017. The data I used ended in December, but I was able to get more updated prices from the ICO for January and February. This shaded band represents the future.
So the main takeaway is I’m going to hold off on buying coffee futures for a few months.
References
Hopp, H., and Foote, R. A Statistical Analysis of Factors That Affect Prices of Coffee. American Journal of Agricultural Economics, 1963.
Bilder, Richard B. The International Coffee Agreement: A Case History in Negotiation. Law and Contemporary Problems, 1963, vol. 28, no. 2, p. 328–391.
Yorgason, V. The International Coffee Agreement: Prospect and Retrospect. Development and Change, 1976, vol. 7, no. 2, p. 207–221.
Coffeeresearch.org. Effects of Frost on South American Coffee Beans. Accessed February 2017.
Starbucks Corporation. Fiscal 2016 Annual Report. Starbucks Corporation, Form 10-K, 2016, p. 7.